fredpalas
Posted on Dec 23
How My Talk Went: "How Fast Can the Monster Go?" at Barcelona PHP Talks #6
November 27th, 2024 - About 40 people in the room, few empty chairs, and me about to show that FrankenPHP can push 1,991 req/s in production. But let me tell you how this almost didn't happen...
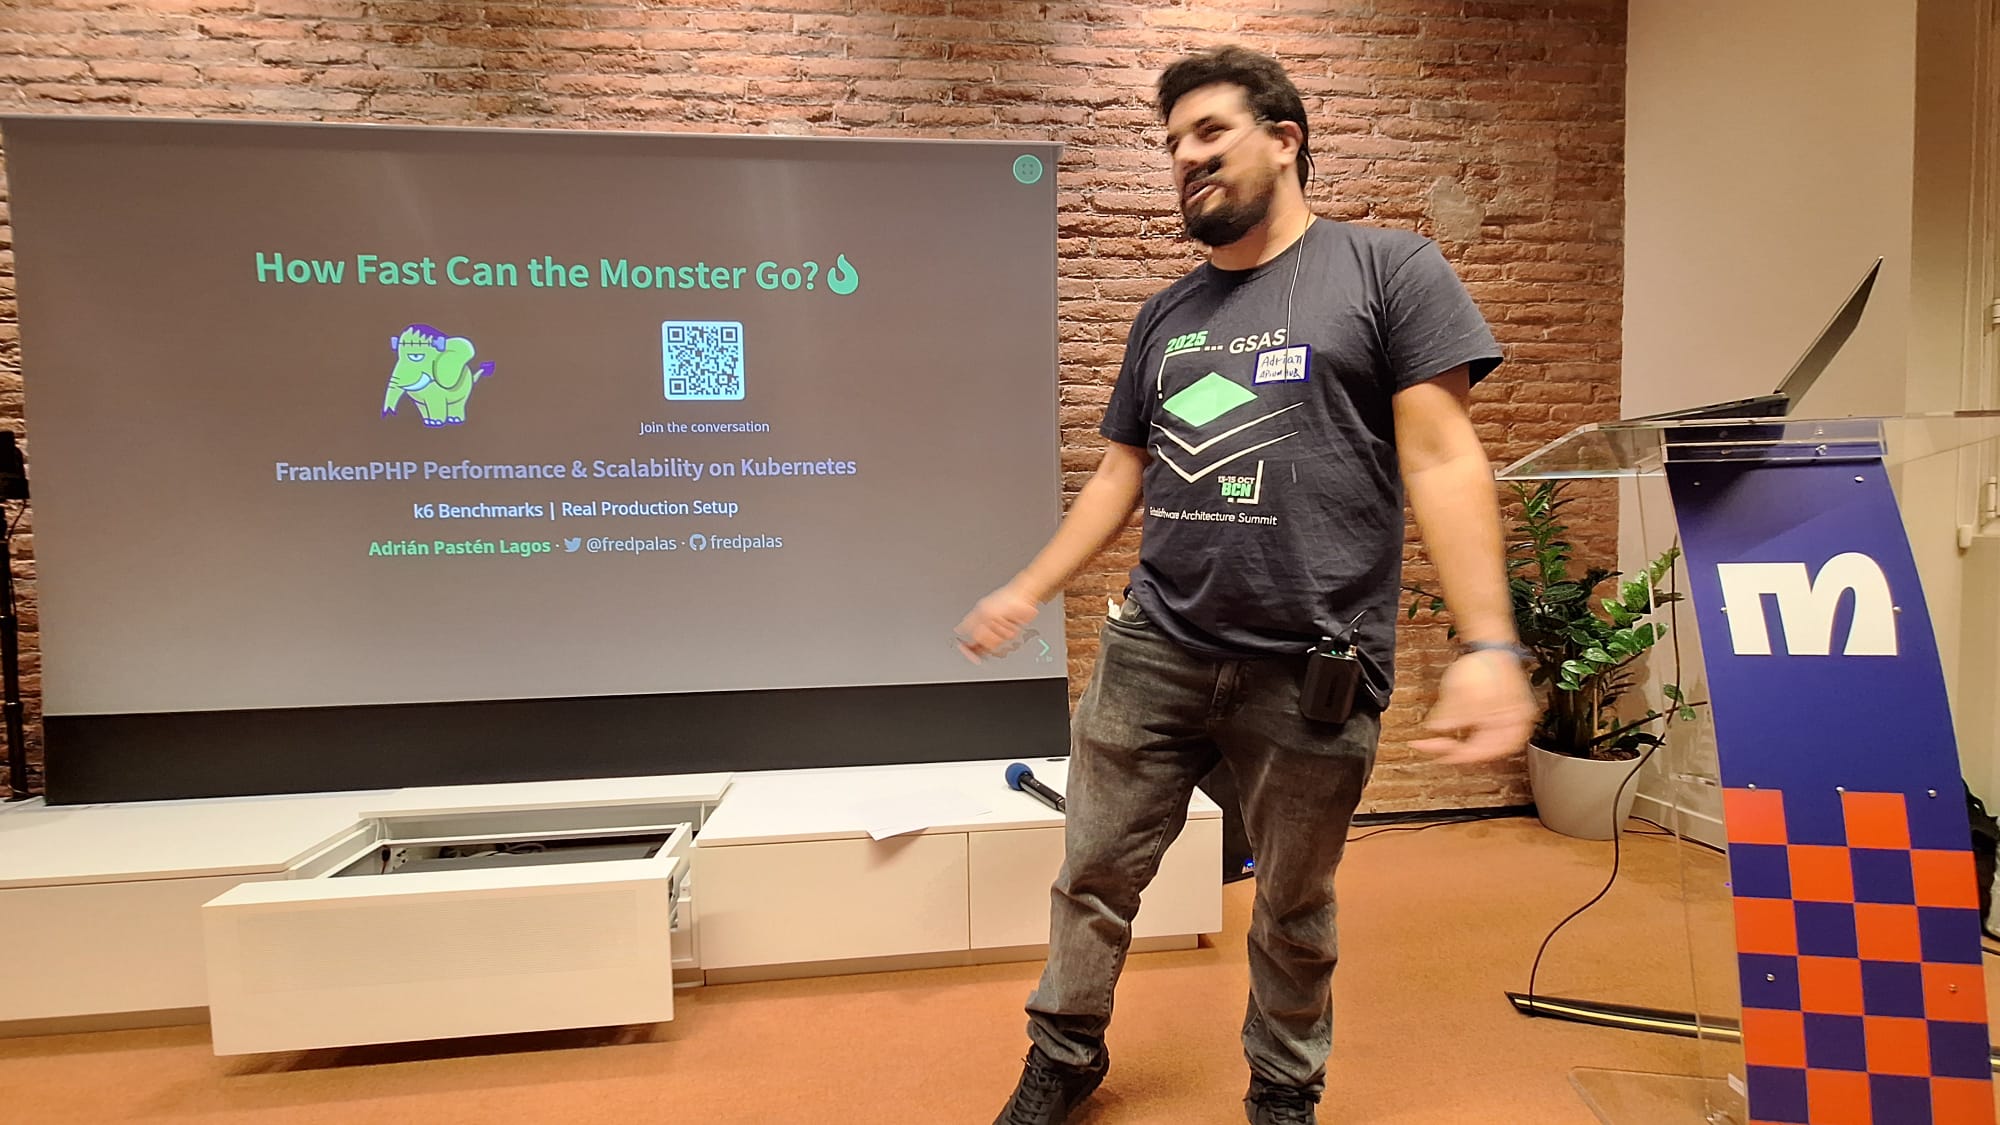 Presenting "How Fast Can the Monster Go?" at Barcelona PHP Talks #6
The Context: Music, Obsession, and Questionable Priorities
Full disclosure: I finished this presentation on November 26th. One day before the event.
Why? Because I spent 3 weeks completely obsessed composing a power metal concept album with Claude and Suno AI. On November 18th, I finally wrapped "Point of No Return: Beyond the Frontier - Final Act" - think Symphony X meets cyberpunk philosophy.
Getting that story out of my head was so satisfying that I almost forgot about the presentation. Priorities? Questionable. But hey, I included this as a warning slide and everyone laughed. Turns out humanizing your tech talks makes them more memorable than just showing graphs.
The Room: 40 People Ready to Talk Performance
Barcelona PHP Talks #6 had solid attendance. The room was nearly full, but more importantly, people actually participated. We got 11 questions on Slido (plus one that just said "Test" 😂), active poll responses, and a lively Q&A.
The Poll Results Were Revealing
What's your PHP setup?
.webp) Poll results: 80% still using PHP-FPM + Nginx
Poll results: 80% still using PHP-FPM + Nginx
- 80% still running PHP-FPM + Nginx (the tried and true stack)
- 20% using Apache mod_php (someone asked if they were doing WordPress 😄)
- Only 8% on FrankenPHP
- 4% other/don't use PHP
The Nginx+FPM dominance was higher than I expected. Apache surprised me - there's definitely WordPress folks out there.
Do you use auto-scaling in production?
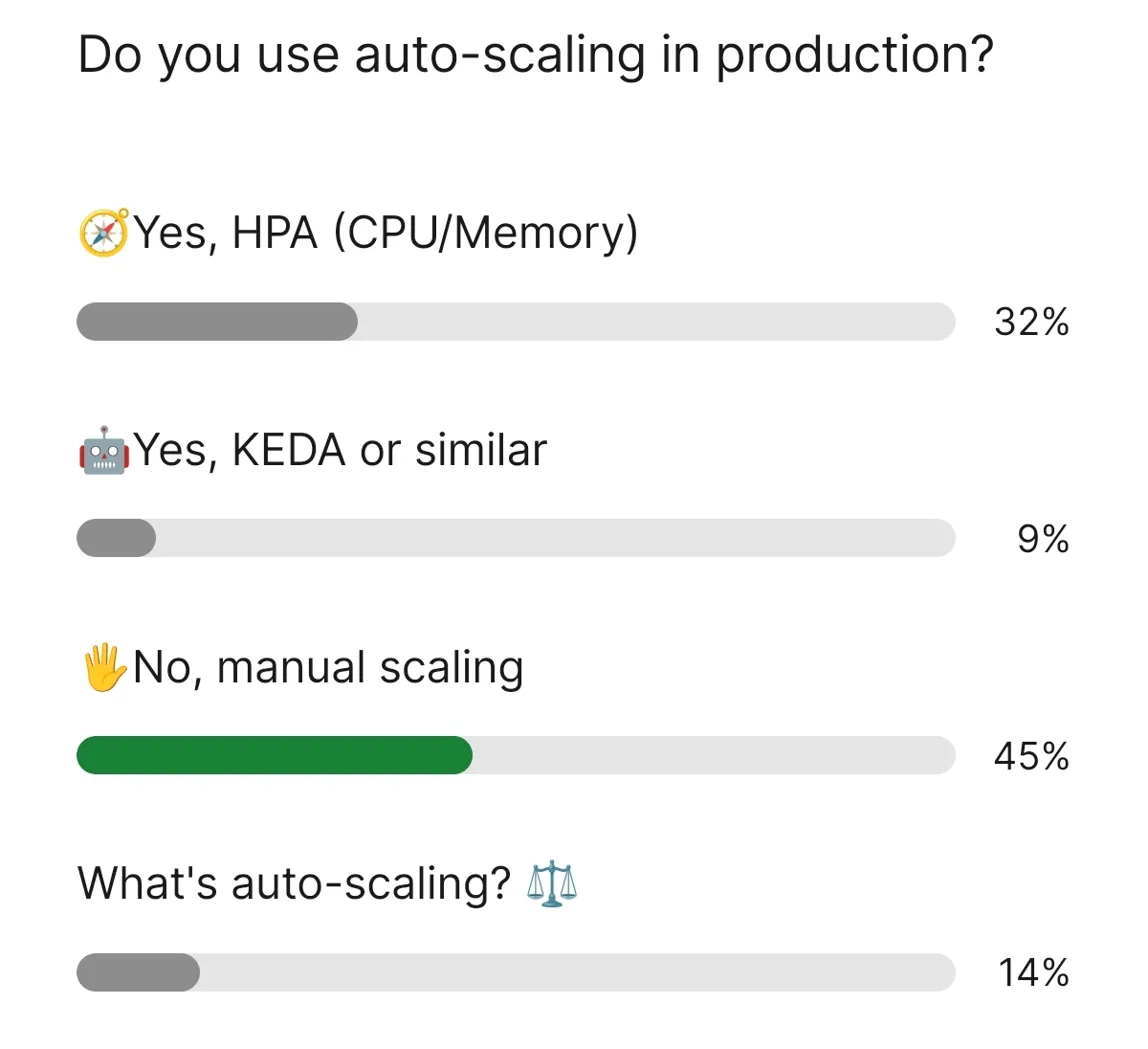 Poll results: 45% still doing manual scaling
- 45% doing manual scaling (almost half!)
- 32% using HPA (CPU/Memory based)
- 9% using KEDA or similar
- 14% asking "what's auto-scaling?"
This one hit hard. Almost half the audience is still scaling manually. There's so much room for improvement in our community.
Do you use OpenTelemetry?
.webp) Poll results: 63% don't use OTEL, 21% don't even know what it is
Poll results: 63% don't use OTEL, 21% don't even know what it is
- 63% don't use it
- 21% don't even know what it is
- 16% use it
Perfect timing for my big reveal about the 44% overhead...
The Presentation: Confidence Meets Improvisation
I walked in feeling good. After years of public speaking and organizing these meetups, I know how to read a room and adjust on the fly. The narrative structure worked - start with the monster hook, build the story, then drop the OTEL plot twist.
One Small Hiccup: KDE Clipboard Betrayal
During the live demo, KDE's clipboard decided to stop cooperating with a command I needed. The audience didn't notice because I just started typing it manually, then pulled another working command from history. Years of live demos teach you to handle these moments without breaking a sweat.
The Live Demo: 1,991 req/s
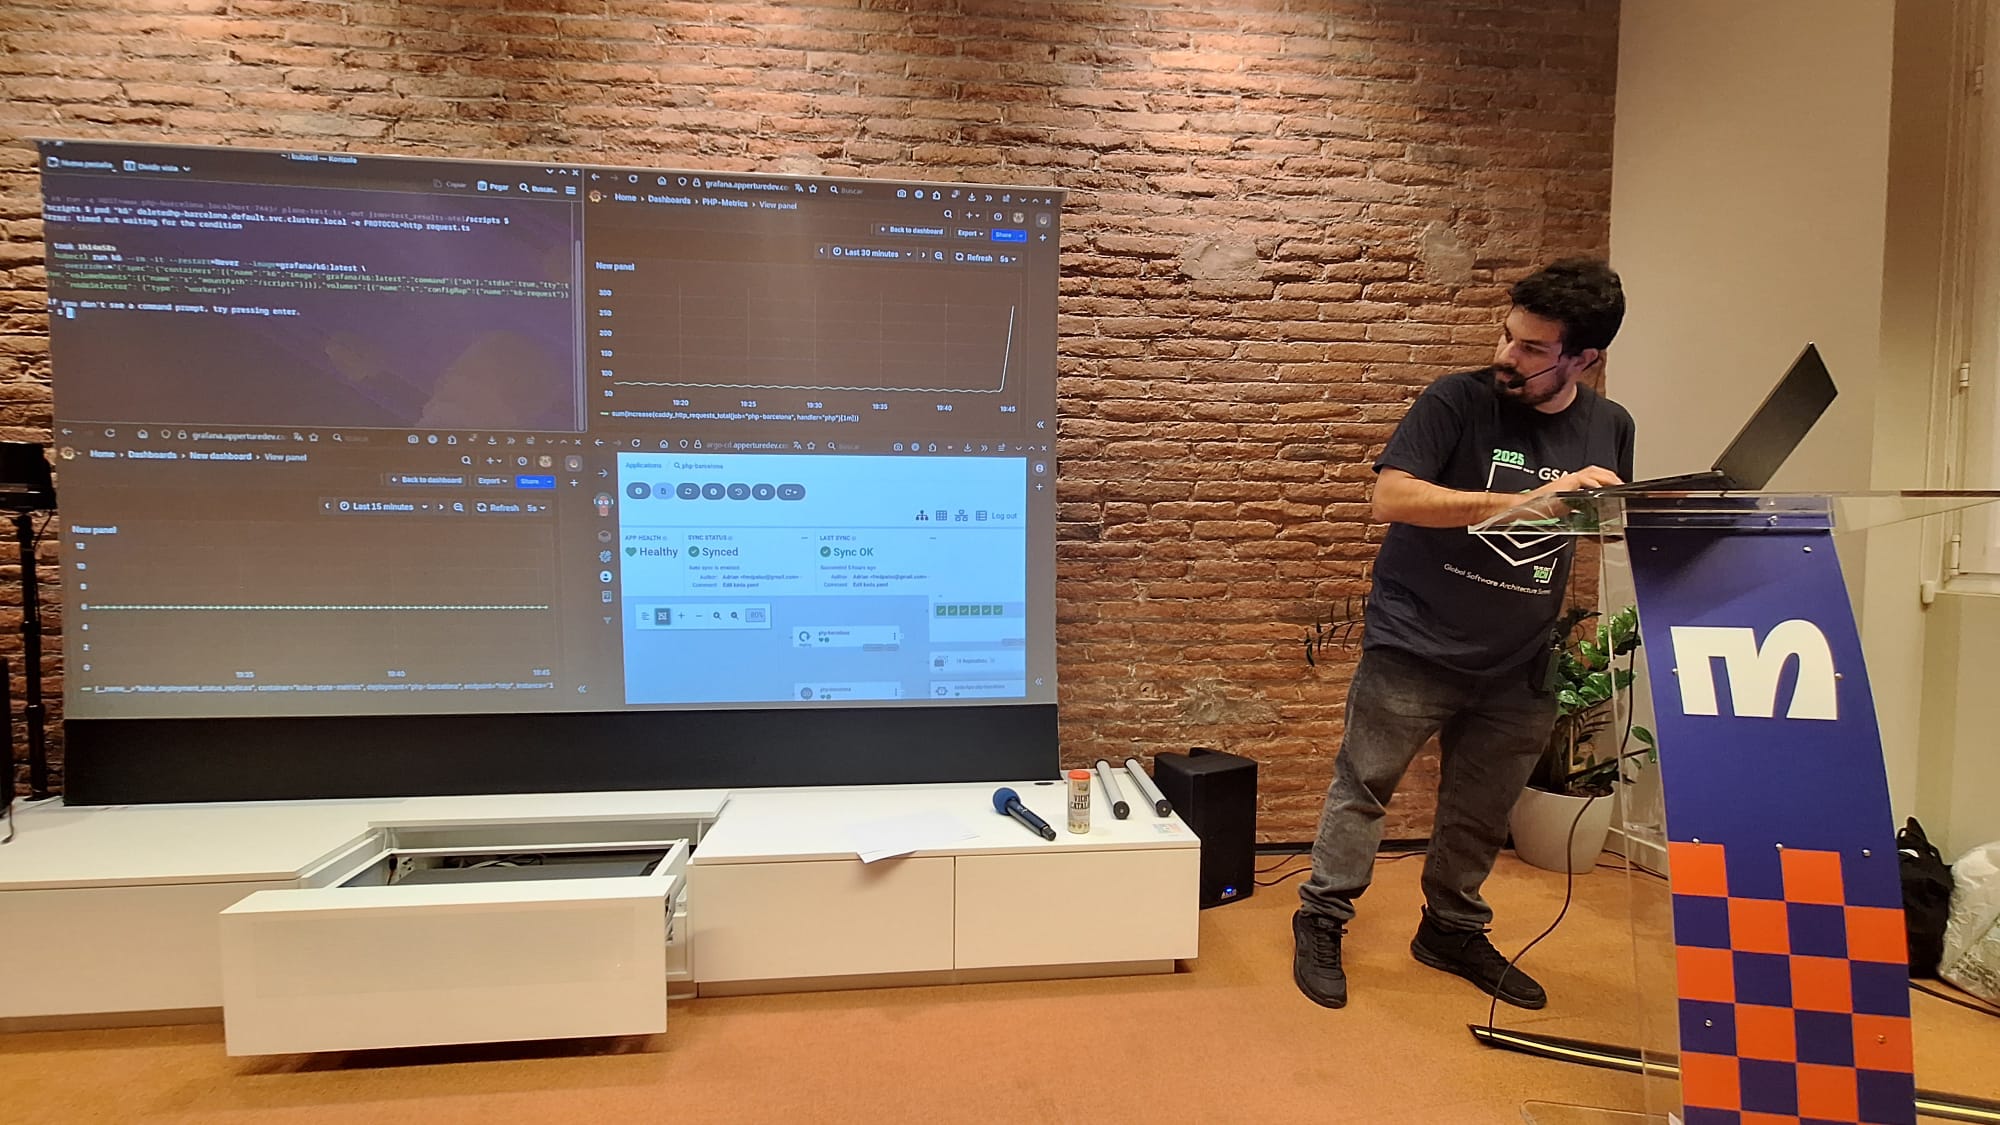 Four-way split screen: k6, Prometheus, Kubernetes, and ArgoCD running live
Time for the real show. I had four windows open:
- k6 terminal pumping traffic
- Prometheus graphs showing real-time metrics
- Kubernetes dashboard with pods scaling
- ArgoCD sync status
Live result: 1,991 req/s
Not the 2,519 req/s from my best test run, but still solid. Why the difference? Could be running on apperture-2 instead of the main apperture-3 node, or the fact that people were actually browsing the blog during the demo (real traffic FTW), or maybe those 2-result queries taking slightly longer.
Either way, it's still a 4x improvement over PHP-FPM (600 req/s baseline), so the point landed.
Pods Scaled Almost Instantly
Someone asked if the scaling went straight from 6 to 16 pods. I wasn't watching that closely during the demo, but people told me afterward it was "almost all at once." That's KEDA responding to real traffic metrics, not CPU guesswork.
The Magic Moment: When the Percentiles Hit
There was this moment when I showed the p90 and p95 latency numbers where you could feel the room processing it. The differences were stark:
With OTEL:
- p95 latency: 1,000ms
- Throughput: 1,400 req/s
Without OTEL:
- p95 latency: 569ms (43% better)
- Throughput: 2,519 req/s (80% more capacity)
That's when it clicked for people.
The Plot Twist: OTEL Eating 44% of Our Capacity
When I revealed that OpenTelemetry auto-instrumentation was consuming 44% of our capacity, the room reacted:
- Recognition laughs
- Heads nodding
- Murmurs of "oh, THAT'S why..."
Some people already suspected it. Others found their perfect excuse not to use it. But the real message isn't "don't use OTEL" - it's understanding the trade-off:
Development/Debugging: Go ahead, use full auto-instrumentation
Production: Disable it or use 1-5% sampling
That 63% who don't use it? Now they know why rushing to implement it might not be smart.
Questions That Actually Matter
"Any problems with persistent DB connections?"
Good question. As an architect, I've seen memory leaks happen with Doctrine. My approach:
- Clear cache on long-running processes
- More aggressive garbage collection
- Most importantly: Reduce query complexity
- Apply DDD - separate contexts to reduce complexity
Worker mode + persistent connections = speed, but you need to understand what you're getting into.
"Too many tools in your setup?"
Andra made a sharp observation: "Your setup looks optimized but uses many tools - doesn't that affect you?"
My answer: These tools are necessary for visibility. You need SRE support to understand the metrics. More visibility = better debugging. This isn't accidental complexity - it's essential complexity for understanding production.
"How do you justify dev time to management?"
THE question everyone wants answered. My framework:
- Talk to PO/PM - do proper refinement
- Frame it for users - fluidity and speed matter
- Use surveys and real feedback - data wins arguments
- Prioritize by value - focus on features users care about
As always: it depends. But this framework gives you a starting point for the conversation.
The person seemed satisfied - at least they had something to work with.
The Spotify Incident: Performance Testing 101
Everyone laughed at this one. While testing locally with Docker, I got weird inconsistent results:
- Run 1: 3,778 r/s ✓
- Run 2: 3,256 r/s 🤔
- Run 3: 3,700 r/s 🤷
The culprit? Spotify playing power metal in the background.
The lesson: Performance testing needs consistent environments. That's why my most reliable results came from the CI/CD pipeline inside the cluster - controlled, reproducible conditions.
Watch the Full Talk
Want to see the whole presentation including the live demo? Here it is:
Full talk: "How Fast Can the Monster Go?" at Barcelona PHP Talks #6
Post-Talk: "I've Learned Something"
After wrapping up, people came up with solid feedback:
- "Good presentation, I learned something"
- Questions about fixing specific production issues
- Doctrine memory leak troubleshooting
- Genuine interest in trying this setup
One comment stuck with me: someone said they appreciated how I framed visibility as a necessity, not a luxury. That made me feel like the observability message landed right.
What I Hope They Take Away
I had three goals for this talk:
- Learn Kubernetes scaling - KEDA with custom metrics beats standard HPA
- Observe your code - understand what's actually happening
- Know your options - FrankenPHP is a solid modern choice
If people leave with even one of these, I'm happy.
The Core Message
If I had to sum it up: You can optimize resources and get serious performance gains.
It's not just FrankenPHP vs PHP-FPM. It's about:
- Measuring what matters
- Understanding trade-offs
- Making informed decisions
- Optimizing where it counts
What's Next
The talk was recorded and is now available on YouTube (link above).
Already thinking about next content:
- DDD lessons from my work at Apiumhub
- OTEL overhead mitigation in production
- Maybe taking this talk to other events
Still deciding if I'll open-source the complete repo with all the configs. Thinking about it.
Final Thoughts
After 3 weeks obsessed with cyberpunk power metal, then cranking out a presentation in one day, then delivering it to 40 people... I feel good. Energized.
Getting that album out of my head was satisfying (seriously, finishing that story felt amazing). Now I'm more relaxed and ready to dive into new projects harder.
Priorities still questionable (music > presentations), but it all worked out. 😅
Technical Data for Reference
Final Configuration:
- Worker Mode: ✓
- Persistent PDO: ✓ PostgreSQL
- OTEL: ✗ Disabled in prod
- Auto-scaling: ✓ KEDA + Caddy metrics
Results by Environment:
- Local Docker: 3,778 r/s | avg: 67ms | p95: 87ms
- CI/CD Pipeline ⭐: 2,378 r/s | avg: 275ms | p95: 798ms | 452K requests/3min
- Live demo: 1,991 r/s | avg: 391ms | p95: 569ms
vs PHP-FPM: 4-6x faster (baseline: 600 r/s)
Stack: FrankenPHP + PostgreSQL + KEDA + ArgoCD + Caddy + Prometheus + k6
Find me:
- @fredpalas on Twitter/X
- github.com/fredpalas
- gitlab.com/fredpalas
- linkedin.com/in/adrian-pasten
- Point of No Return on SoundCloud
Questions? Want to try this setup? Hit me up on any platform.